Application performance monitoring
Application monitoring focused on the errors and regressions users actually feel.
Squasher gives product and engineering teams app-level monitoring for errors, logs, traces, session replay, release context, and AI triage without claiming to replace every infrastructure dashboard.
Database, HTTP, and queue insights ride on top of the same OTLP spans.
Fit
Use Squasher for app failure triage. Pair it when broad APM is still needed.
The scope is application-level debugging: errors, logs, traces, replay, releases, and AI triage. Keep dedicated APM or infrastructure monitoring when performance dashboards are the main job.
Use Squasher when application monitoring starts from errors, regressions, logs, traces, replay, releases, and responder review.
Pair Squasher with a traditional APM when infrastructure metrics, host dashboards, or deep service performance analysis are the main requirement.
Keep the workflow scoped to supported telemetry and do not treat Squasher as a generic replacement for every application performance monitoring tool.
Common pain
Performance symptoms need cause, context, and action.
Traditional charts are useful, but responders still need the error group, release, trace, logs, replay, and owner that explain what changed.
Dashboards can show latency or failure symptoms without connecting them to the error group engineers need to fix.
Application regressions are harder to prioritize when logs, traces, replay, and releases live in separate tools.
Product teams need customer-impacting context, not only service health charts built for platform operations.
A new deploy can change error rate before anyone knows which route, component, or owner should respond.
Workflow
A production monitoring path built around app regressions.
Squasher starts from the failure and keeps the evidence close enough for engineers to review quickly.
Capture the failure
Start with SDK errors, log drains, OpenTelemetry traces, replay events, and release metadata from the affected application.
Correlate context
Keep stack traces, nearby logs, trace spans, session replay, environment tags, and deploys in one review path.
Find the regression
Look for first-seen timing, recent releases, affected routes, and repeated failure signatures instead of only chart movement.
Triage with AI
Summarize likely cause, impact, and next steps while keeping responders in control of verification and fixes.
Route the owner
Use the reviewed incident context to assign ownership, update alerts, and decide whether another APM should stay in the loop.
Comparison table
Squasher versus APM, logs, error tracking, and infrastructure monitoring.
| Category | Common fit | Squasher fit |
|---|---|---|
| Traditional APM | Best for broad service performance, infrastructure metrics, host dashboards, and platform operations. | Best for application failure triage with errors, logs, traces, replay, releases, and AI context. |
| Log management | Best for search, retention, compliance, and high-volume infrastructure records. | Uses logs as incident evidence beside grouped errors, traces, replay, and releases. |
| Error tracking | Best for exceptions, stack traces, grouping, and source-map debugging. | Starts from errors, then expands into logs, traces, replay, ownership, and AI triage. |
| Infrastructure monitoring | Best for hosts, containers, network, saturation, and platform health. | Not a full infrastructure APM suite; focused on app-level incidents users feel. |
Use cases
App monitoring is strongest when it stays close to customer impact.
Squasher is built for incidents where the path from symptom to cause should be shorter than a dashboard handoff.
Frontend performance symptoms
Connect slow or broken user flows to browser errors, replay context, network moments, and release changes.
Backend exceptions
Review request logs and trace context beside grouped server failures instead of hunting across tools.
Release regressions
Tie new error spikes to deploy timing, source maps, affected routes, and ownership before rollback decisions.
Customer-impacting incidents
Give responders a concise evidence trail for support, engineering, and status updates.
APM overlap evaluation
Decide which workflows stay in a broad APM and which app failure workflows move to Squasher.
FAQ
Answers for teams evaluating application performance monitoring tools.
Short answers around APM scope, traces, logs, infrastructure metrics, error monitoring, and when to pair Squasher with another platform.
- Is Squasher a full APM suite?
- No. Squasher is not trying to replace every infrastructure metric dashboard. It is focused on application errors, logs, traces, replay, releases, and AI triage.
- How is APM different from error monitoring?
- APM covers broad performance health. Error monitoring starts from failures users feel. Squasher is strongest when those failures need logs, traces, replay, and release context.
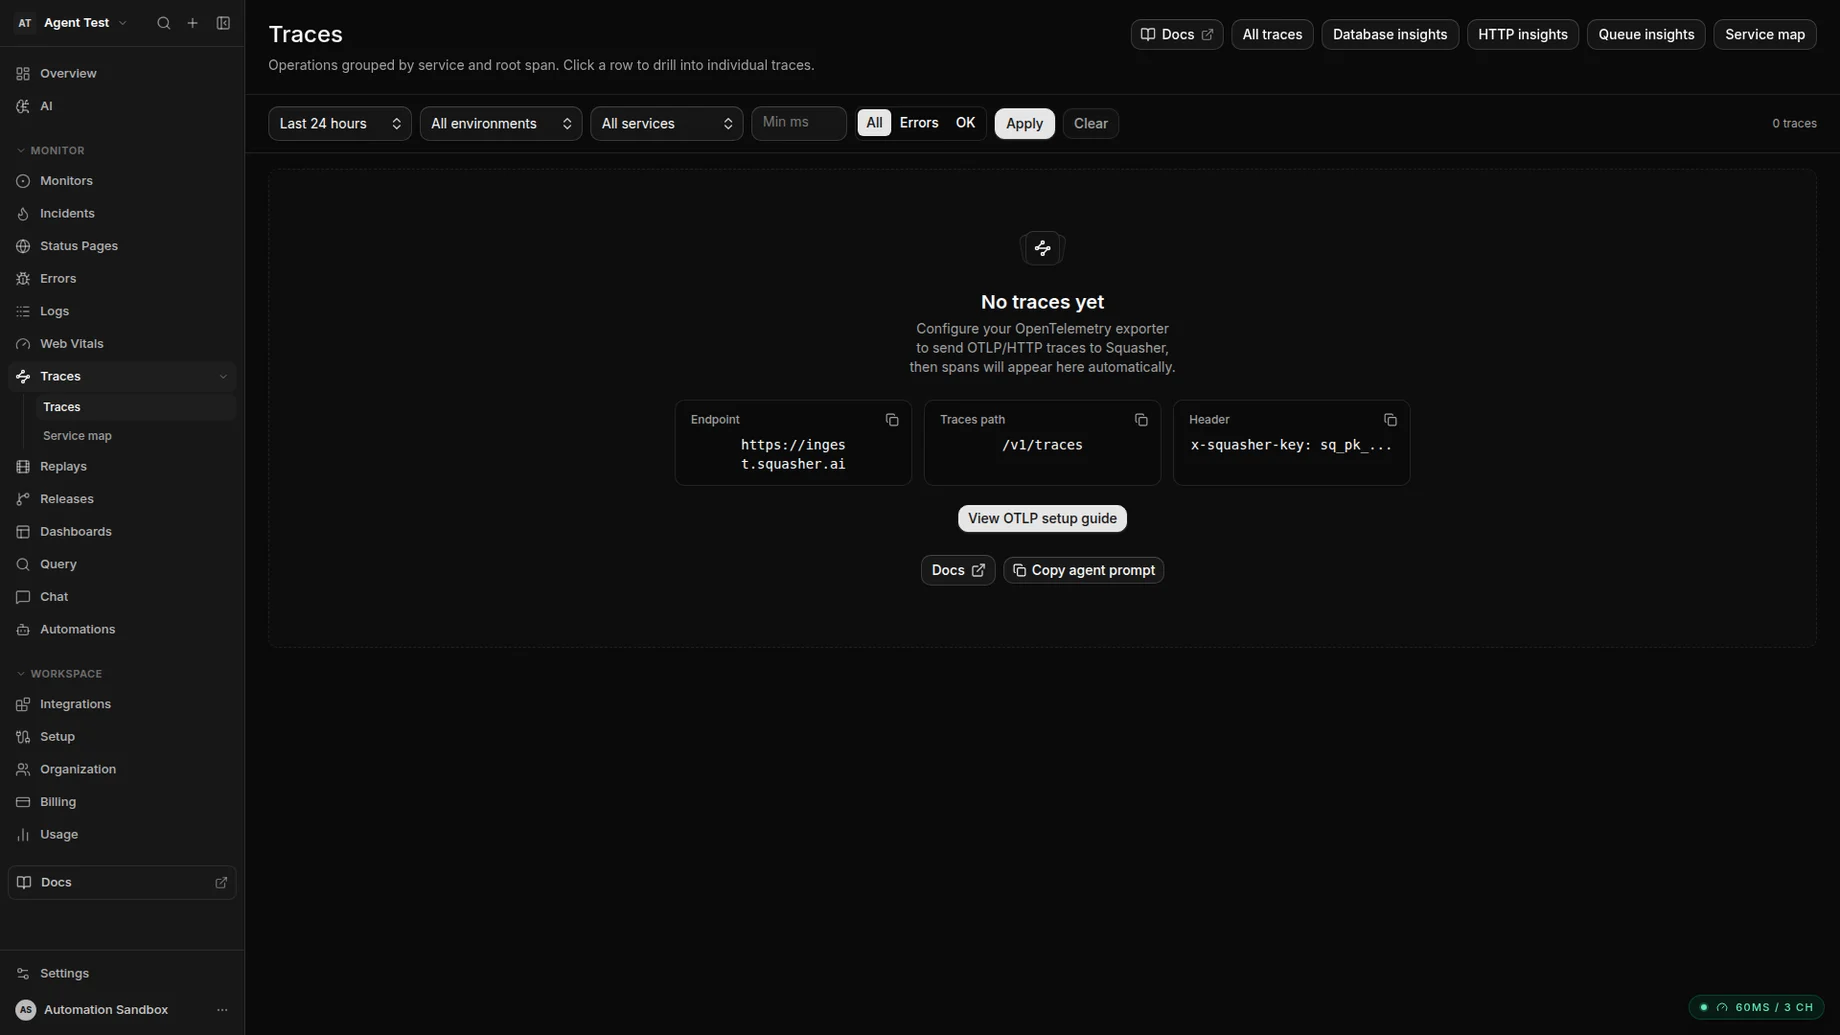
- Does Squasher support traces?
- Yes. Squasher accepts OpenTelemetry traces and uses trace context to enrich application failure triage.
- Does Squasher replace log management?
- No. Squasher keeps logs useful for incident triage, but teams may still keep a dedicated log platform for long retention, compliance, or infrastructure operations.
- When should we pair Squasher with another APM?
- Pair Squasher with another APM when host metrics, service-level performance dashboards, infrastructure monitoring, or deep platform operations are the primary requirement.
- How does AI triage fit into application monitoring?
- AI triage summarizes the evidence around an error or regression so responders can review likely cause, impact, and next steps faster.
App-level monitoring
Monitor the regressions that turn into user-facing incidents.
Connect errors, logs, traces, replay, releases, and AI triage so responders can move from symptom to cause without another dashboard handoff.