Log monitoring
Log monitoring that turns production noise into AI-triaged incidents.
Squasher is log monitoring software for teams that need platform logs, application context, errors, traces, sessions, and releases connected before an incident turns into a long search session.
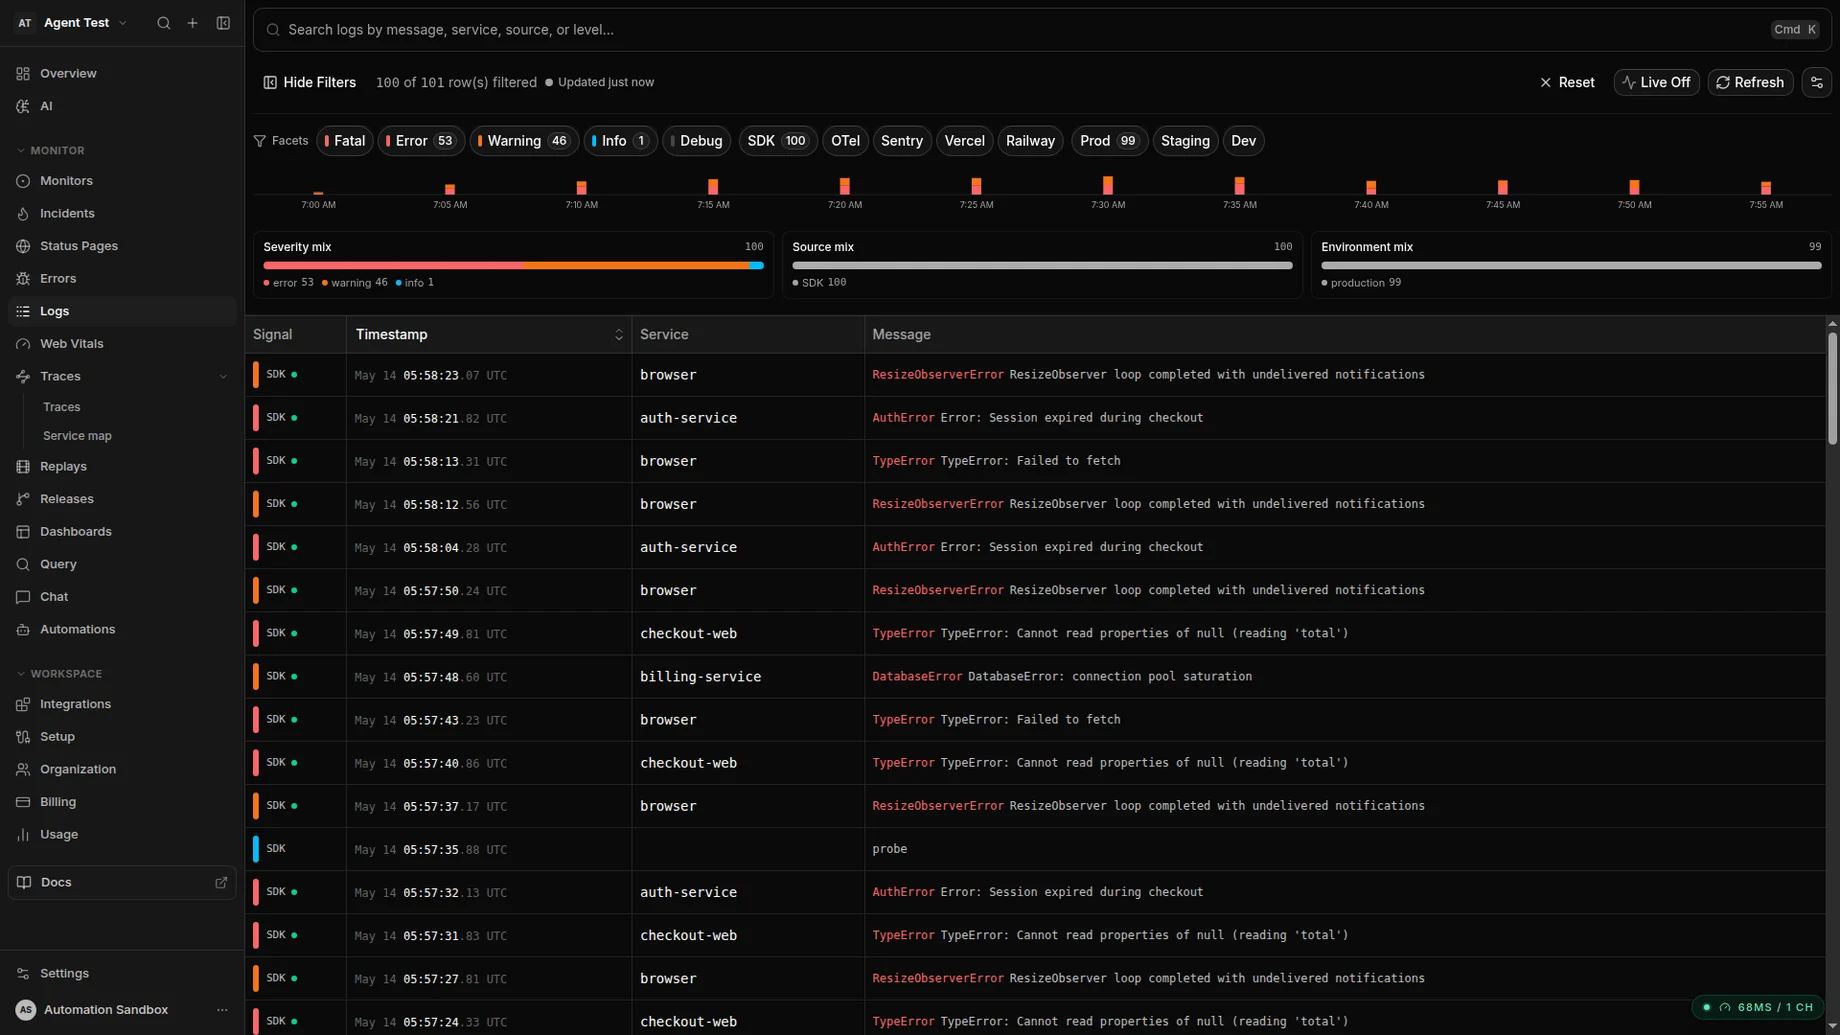
Severity, source, and environment facets keep the noisy stuff filterable while the sparkline keeps spikes obvious.
Problem
Logs are useful only when they stay attached to the failure.
A log line can show the cause, but only if responders can see the related error, trace, session, release, and service context without switching tools.
Platform drains
Ingest Vercel, Cloudflare, Railway, and cloud platform logs without copying them by hand.
Application logs
Forward structured service logs from Node, Python, and other runtime logging paths.
OTLP logs and traces
Accept OpenTelemetry signals when logs already pass through a collector.
Error context
Connect logs to exceptions, releases, owners, replay, and grouped incident history.
Workflow
From raw log stream to reviewed incident context.
Squasher treats logs as evidence in the debugging workflow, not as an isolated warehouse that responders have to query from scratch.
Ingest logs from drains, OTLP, SDKs, and HTTP sources.
Normalize source, severity, service, release, and project metadata.
Correlate log windows with exceptions, traces, session replay, and deploys.
Group repeated noise without losing the first customer-impacting signal.
Summarize likely cause, owner, and next debugging step for responders.
Setup
Supported sources for logs that belong in incident triage.
Start with platform drains, OpenTelemetry, or application loggers, then connect the stream to the same project where errors and sessions already land.
Vercel log drain
Route runtime and deployment logs from Vercel into Squasher, then correlate them with release regressions and error groups.
Cloudflare logs
Bring edge and worker logs into the same debugging timeline as application exceptions and traces.
Railway logs
Forward Railway service logs so deploy failures and runtime errors appear with project context.
OpenTelemetry logs
Send OTLP logs and traces from an existing collector when you want vendor-neutral telemetry routing.
Node logging
Use Pino or Winston integrations when service logs should travel with first-party application context.
Use cases
Designed for application logs that point to a fix.
Use Squasher when the log stream needs to explain customer impact, release context, and ownership instead of becoming another saved search.
A Vercel deploy starts emitting errors after a release.
Cloudflare Worker logs explain an edge failure that never reached the browser.
Railway service logs show the crash loop behind a customer incident.
OTLP logs and traces identify the backend span tied to a frontend exception.
Node service logs from Pino or Winston provide the missing request context.
Comparison
Squasher versus log-only tools, broad suites, and log lakes.
| Category | Strength | Common gap | Squasher approach |
|---|---|---|---|
| Log-only tools | Strong search, filtering, dashboards, and retention controls. | Teams still have to connect logs to user-facing errors and owners. | Uses logs as incident evidence next to errors, traces, replay, and releases. |
| Broad observability suites | Deep metrics, traces, infrastructure views, and enterprise controls. | Setup and alert tuning can be heavy for product teams focused on fixes. | Focuses the workflow on production failures and reviewed AI triage. |
| SIEM or log lake | Useful for security investigations, archives, and compliance programs. | Not usually shaped around application error ownership or fix workflows. | Keeps application logs close to the incident timeline without claiming SIEM coverage. |
| Squasher | Connects logs to exceptions, sessions, traces, releases, and project context. | Not a generic warehouse for every possible enterprise log retention use case. | Optimized for debugging production incidents and turning noise into action. |
FAQ
Answers for teams comparing log monitoring tools.
Short, public-safe answers around log monitoring, log management, supported sources, retention, privacy, and OpenTelemetry.
- What is log monitoring?
- Log monitoring collects, searches, alerts on, and reviews application or platform log events so teams can spot production failures quickly.
- How is log monitoring different from log management?
- Log management is the broader storage, routing, retention, and compliance workflow. Log monitoring is the operational layer that turns the important records into alerts, triage, and debugging context.
- Which log sources can Squasher ingest?
- Squasher supports platform log drains, OpenTelemetry logs, HTTP ingest, and application logging paths such as Pino, Winston, and Python logging.
- Does Squasher replace a SIEM or enterprise log lake?
- No. Squasher focuses on production application incidents and debugging evidence, not security event management or long-term compliance archives.
- How does Squasher handle retention and privacy?
- Use the current plan documentation and your ingestion controls for retention and privacy choices. Squasher keeps the marketing page focused on supported workflows instead of hardcoding limits.
- Can Squasher work with OpenTelemetry logs?
- Yes. Teams with an existing collector can send OTLP logs and traces to Squasher so log lines stay connected to errors, spans, and incidents.
2026-05-06
Start with the next noisy production log.
Bring platform logs, application loggers, and OTLP signals into the same triage flow as errors, traces, sessions, releases, and AI summaries.