OpenTelemetry
Send OpenTelemetry logs, traces, and errors to Squasher.
Use Squasher as an OTLP destination that turns OpenTelemetry signals into grouped errors, debugging timelines, incident context, and AI-assisted triage.
OTLP spans land next to the errors and logs they correlate with.
Signals
OTLP data is useful when it becomes debugging context.
Squasher accepts OpenTelemetry signals, extracts error telemetry, and keeps the surrounding logs, traces, metrics, and attributes close to the incident.
Traces
Ingest OTLP spans, exception events, status codes, service names, and release data.
Logs
Store OTLP log records so surrounding context stays attached to the error timeline.
Metrics
Accept metric points for operational context and queryable timelines.
Errors
Extract error groups from exception span events, error spans, and severe log records.
Setup
Use the collector or send OTLP directly.
The OpenTelemetry Collector is the cleanest path for shared pipelines. Direct OTLP endpoints work when your SDK can configure the Squasher endpoint and auth header.
OTel Collector exporter
Add Squasher as an OTLP/HTTP exporter when your services already send telemetry through a collector.
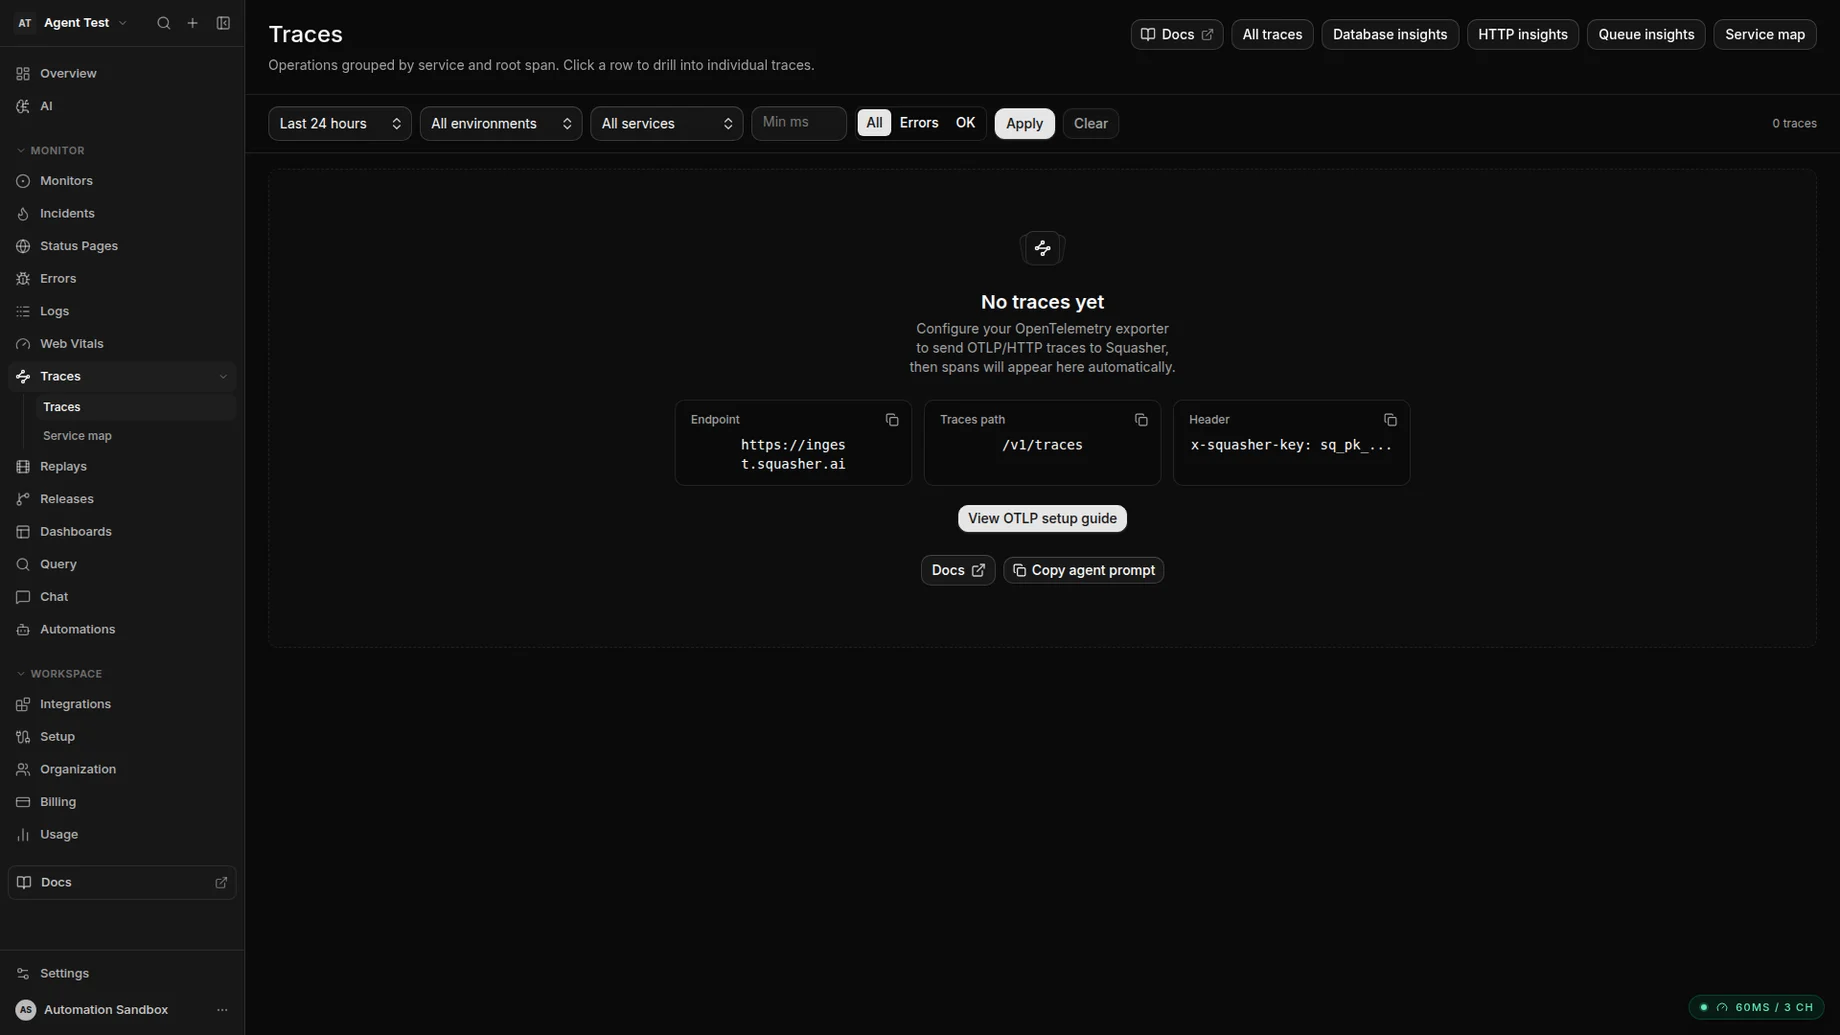
Direct OTLP endpoint
Point OpenTelemetry SDKs at `https://ingest.squasher.ai` and send traces, logs, or metrics to the matching `/v1/*` endpoint.
Language SDKs
Use the standard OpenTelemetry SDK or agent for Node.js, Python, Go, Java, and other supported runtimes.
Squasher SDKs
Pair OpenTelemetry backends with Squasher browser or framework SDKs when frontend replay and error context matter too.
otel-collector-config.yaml
exporters:
  otlphttp/squasher:
    endpoint: https://ingest.squasher.ai
    headers:
      x-squasher-key: "sq_pk_your_api_key"

service:
  pipelines:
    traces:
      exporters: [otlphttp/squasher]
    logs:
      exporters: [otlphttp/squasher]
    metrics:
      exporters: [otlphttp/squasher]
Workflow
From standard telemetry to reviewed incident context.
Squasher does not try to replace OpenTelemetry concepts. It receives OTLP data and turns error-related signals into work engineers can verify.
Send OTLP logs, traces, metrics, and error signals through a collector or direct endpoint.
Preserve service, environment, release, namespace, and span attributes as debugging context.
Extract error groups from exception events, error spans, and severe log records.
Correlate telemetry with logs, replay, releases, project ownership, and incident context.
Summarize likely cause and next steps for responders without replacing engineering review.
Use cases
Built for teams that already speak OpenTelemetry.
Use Squasher when OTLP telemetry needs to land in an error-monitoring workflow instead of ending as another raw signal stream.
Multi-service backends already instrumented with OpenTelemetry.
Teams moving from vendor-specific agents toward standard OTLP pipelines.
Vercel, Cloudflare, or Node apps that need logs and traces next to error groups.
Collector fan-out where Squasher receives debugging-focused telemetry.
Services that need error grouping without adding another language-specific SDK first.
Comparison
Squasher versus generic telemetry storage and vendor-specific agents.
| Category | Strength | Common gap | Squasher approach |
|---|---|---|---|
| Official OpenTelemetry docs | Best source for vendor-neutral instrumentation and collector concepts. | They do not choose a debugging workflow or incident destination for your team. | Focuses on receiving OTLP data and turning it into fix-oriented context. |
| Generic telemetry storage | Good for central pipelines, retention, and downstream routing. | Raw telemetry still needs grouping, ownership, and incident-ready summaries. | Groups error telemetry and connects it to logs, replay, releases, and owners. |
| Vendor-specific agents | Deep platform features when the whole stack uses one vendor. | Migration and multi-language coverage can become tied to one proprietary path. | Accepts standard OTLP while staying focused on application failure triage. |
| Squasher | OTLP destination for errors, logs, traces, metrics, and AI-assisted triage. | Not a replacement for the full OpenTelemetry specification or collector docs. | Receives telemetry and shapes it into production debugging workflows. |
FAQ
Answers for teams sending OpenTelemetry to Squasher.
Short, implementation-focused answers around OTLP endpoints, collector setup, logs, traces, auth, metrics, and debugging context.
- What OpenTelemetry data can Squasher accept?
- Squasher accepts OTLP/HTTP traces, logs, and metrics, then extracts error telemetry from exception span events, error spans, and error or fatal log records.
- Do I need the OpenTelemetry Collector?
- No. You can send directly to Squasher's OTLP HTTP endpoints, but the collector is useful when you already route telemetry through a shared pipeline.
- How does OpenTelemetry improve debugging in Squasher?
- OTLP data gives Squasher service names, releases, environments, traces, logs, and error context that can be grouped and summarized for responders.
- How is authentication handled?
- Pass a Squasher API key with the `x-squasher-key` header or `Authorization: Bearer` when your OpenTelemetry SDK or collector supports standard auth headers.
- Are non-error logs still useful?
- Yes. Error-level telemetry creates error groups, while surrounding non-error OTLP logs can still provide the context that explains what happened before and after the failure.
Use OTLP as the path into error triage.
Send OpenTelemetry logs, traces, metrics, and error context to Squasher so responders can debug production incidents with the evidence already attached.