Session replay
Session replay for debugging real production errors.
Squasher shows the browser session behind the error, then keeps replay connected to logs, traces, releases, network moments, privacy controls, and AI triage.
Replays jump straight to the moments before the error fired so you see what your customer saw.
Problem
Replay helps only when responders can see the failure around it.
Standalone replay can show what a user did, but production debugging needs the related stack trace, logs, failed requests, release, and owner too.
User session
Review page transitions, interactions, and idle-skipped playback around the failure.
Error markers
Jump from the replay timeline to replay-linked exceptions and frontend error groups.
Network context
Inspect failed or slow requests alongside the user action that triggered them.
Backend evidence
Connect browser sessions to logs and traces that carry the same session identity.
Workflow
From recorded session to reviewed fix path.
Squasher keeps raw replay payloads out of the first response path and starts with searchable rollups, timeline moments, and correlated telemetry.
Capture replay segments from browser sessions with sampling controls.
Attach session identity to errors, console events, network events, and traces.
Index replay rollups so responders can search before loading raw segments.
Inspect important timeline moments around failed requests and error markers.
Use AI triage to summarize the replay evidence with logs, releases, and likely next steps.
Setup
Capture replay with controls that match production traffic.
Use the browser capture path, pair it with framework telemetry, and make privacy defaults explicit before collecting customer sessions.
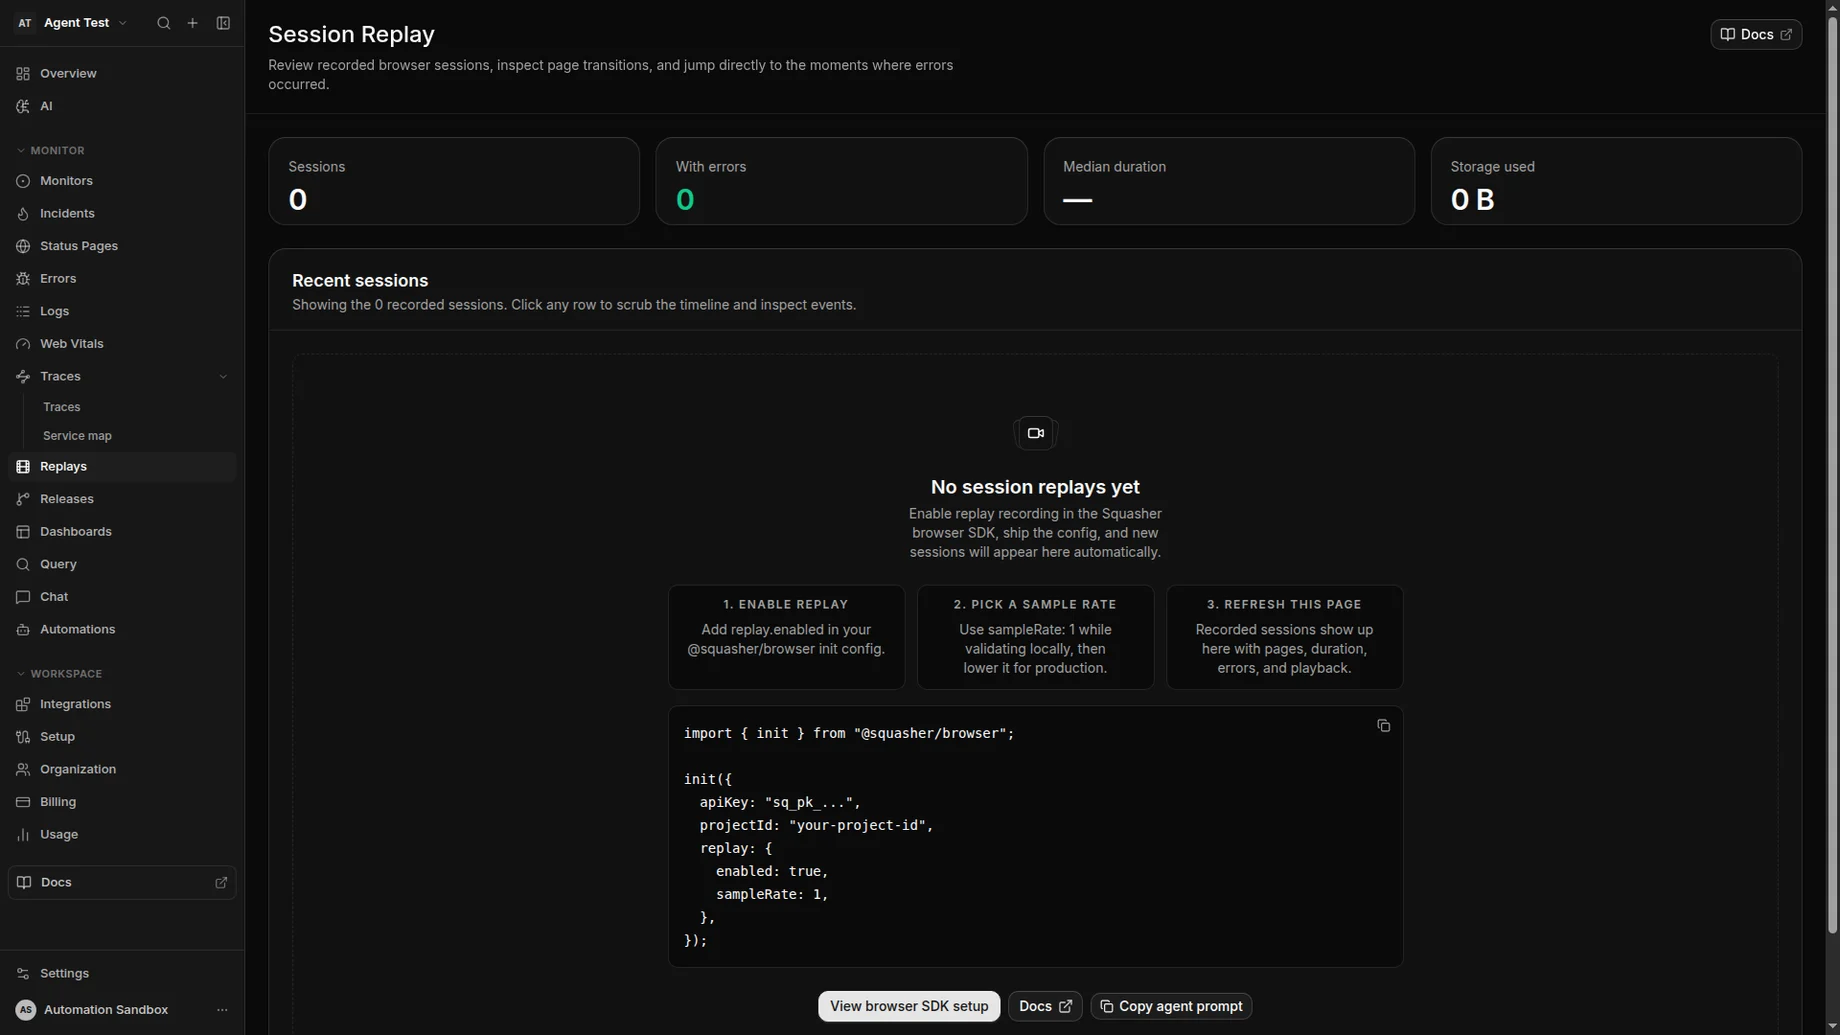
Browser SDK replay
Enable replay capture in the Browser SDK, then send replay segments in the background with session identity attached to telemetry.
Next.js applications
Pair browser replay with Next.js errors and traces so frontend failures and server context meet in one workflow.
Replay search and inspect
Use replay search and inspect APIs to filter sessions by URL, release, console errors, failed network requests, and timeline moments.
Privacy defaults
Start with low sampling, mask all text, and block known sensitive selectors before collecting production traffic.
Use cases
Built for replay moments that need engineering action.
Use Squasher when a session replay should explain a production failure, not just describe a browsing pattern.
Frontend exceptions where reproduction steps are missing.
Failed checkout or signup flows with network and console context.
Broken dashboard workflows reported by a customer or support team.
Release regressions where a deploy changes the user path to an error.
Support escalations that need evidence without asking the user to record again.
Comparison
Squasher versus standalone replay, product analytics, and error-only tools.
| Category | Strength | Common gap | Squasher approach |
|---|---|---|---|
| Standalone replay tools | Strong playback, heatmaps, and user behavior review. | The replay can still be detached from stack traces, logs, traces, and ownership. | Starts from the production error and opens the replay around that failure. |
| Product analytics | Useful for funnels, cohorts, events, and adoption questions. | Analytics tools are not always shaped around incident response and fix paths. | Keeps replay focused on debugging real errors rather than broad behavior analytics. |
| Error-only tools | Great at stack traces, grouping, and release regression detection. | Teams may still lack the exact user path that produced the error. | Connects the stack trace to replay, logs, traces, releases, and AI triage. |
| Squasher | Replay sits beside errors, logs, traces, network moments, releases, and owners. | Not a replacement for broad product analytics or every screen-recording workflow. | Optimized for reproducing production failures and moving to a reviewed fix. |
FAQ
Answers for teams comparing session replay tools.
Short, public-safe answers around replay capture, error context, privacy, performance, sampling, retention, and SDK support.
- What is session replay?
- Session replay records a browser session so teams can review user interactions, page changes, console activity, network failures, and error moments after the fact.
- Is session replay the same as screen recording?
- No. Session replay reconstructs browser events and DOM changes for debugging. It is not a video capture of the user's screen.
- How does Squasher connect replay to errors?
- Squasher attaches replay identity to frontend telemetry so errors, logs, traces, network events, and release context can appear around the same session.
- What privacy controls should teams use?
- Start with low production sampling, mask text, and block known sensitive selectors before recording customer traffic.
- How does replay retention work?
- Replay retention follows the replay-specific window for the current plan. Expired or deleted sessions can keep readable metadata when available, while raw segment reads are blocked after retention.
- Which SDKs support session replay?
- Use the Browser SDK for replay capture, and pair it with Next.js or backend SDKs when the debugging workflow needs server-side errors and traces too.
2026-05-06
Start with the session behind the next error.
Connect replay, errors, logs, traces, network moments, releases, and AI triage before the next frontend incident depends on guesswork.